
Perceived Visitor Ethnicity Trends
How much do ethnic groups contribute to project visitation?
-
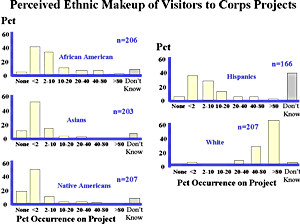
Slightly more than 200 of 220 project managers responded to questions concerning the contribution of different ethnic groups to overall project visitation (Questions 19-20). Based on these responses, it is clear that ethnic minority groups currently have a visible presence on nearly all Corps projects, with individual ethnic groups present on 75 percent (Native Americans) to 99 percent (African Americans) of projects.
While major ethnic groups have a visible presence on most projects, their contribution to total visitation is typically low, less than 10 percent on all but a few projects. Of special interest are a small number of projects on which visitation is dominated by one of the traditional ethnic minority groups, usually Hispanic or African American visitors.
Click on graph to enlarge
 Back to Corps Recreation Trends
Back to Recreation Trends
Back to Programs & PartnershipsHome
Employees Visitors Lake DiscoveryRecreation
Env Compliance Env Stewardship Calendar GlossaryLearning
Tools GETS Partners New Postings Index/Search Ideas ???
Technical Problems
Updated: April 11, 2003